Crystal Kersey, MSc Physical Geography, Project Assistant for the Adaptation and Resilience Training Program (ART) at The Athabasca Watershed Council
Water supply in any region depends on a complex balance of inputs and outputs. While precipitation plays a decisive role, changes in evaporation and transpiration also significantly affect water availability (Hogg, 1997). Factors such as temperature, vegetation type, cloud cover, and wind speed influence evapotranspiration, with temperature and vegetation especially vulnerable to shifts caused by climate change.

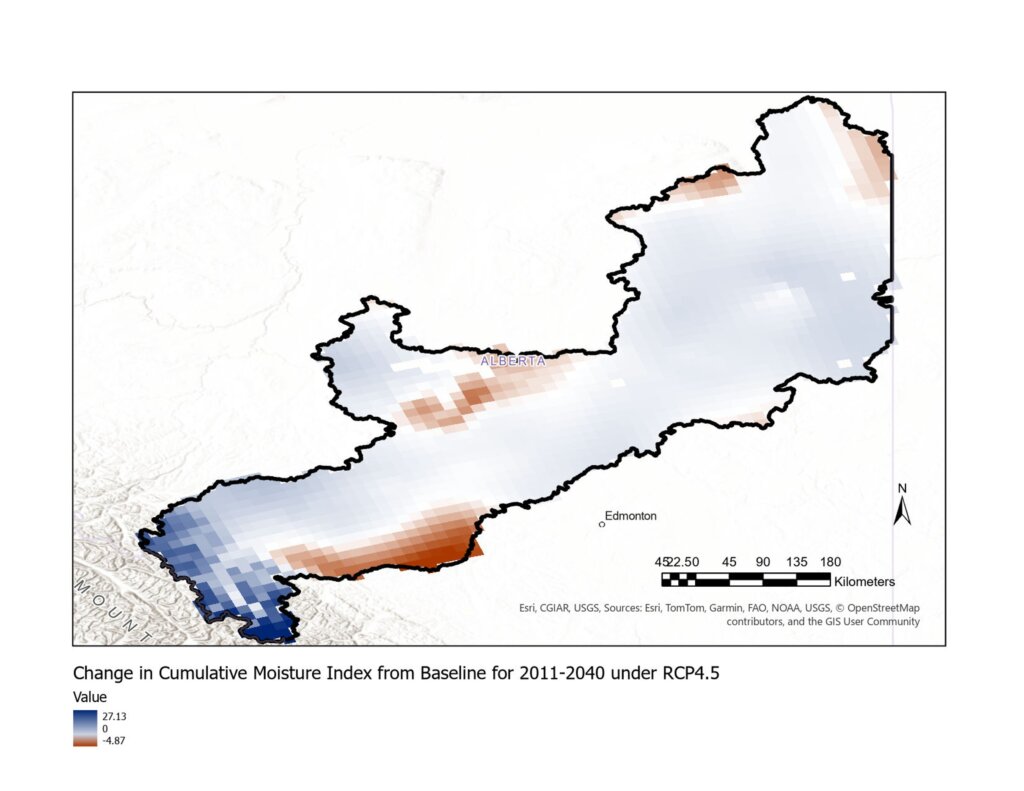
One useful tool for tracking these moisture patterns is the Climate Moisture Index (CMI). This index measures the balance between precipitation and moisture lost through evaporation and plant transpiration (Natural Resources Canada, 2016). When precipitation exceeds evaporative demand, the CMI is positive; when it falls short, the CMI turns negative. In Alberta, this balance is critical because even small climate changes can lead to large shifts in water availability.
Within the Athabasca Watershed, most areas have a positive CMI—especially the mountain headwaters, where snow and rainfall surpass environmental water use. Conversely, drier regions like the south-central and northeastern parts of the basin sometimes experience negative CMI values, indicating long-term moisture deficits (Natural Resources Canada, 2022). Subtracting baseline 1981–2010 values from future projections under a moderate emissions scenario (RCP 4.5) the results suggest that wetter areas will generally become wetter, while drier areas may face increased moisture stress. The mountain headwaters are expected to see CMI increases of up to 27 mm per year, while drier zones along the Upper Pembina may experience slight declines.
However, moisture availability alone doesn’t tell the whole story—how and when that moisture moves through rivers is equally important. To understand changes in river flow due to climate shifts, I analyzed long-term streamflow records from 21 Water Survey of Canada stations located in the mountains and foothills of the Athabasca River Basin (Water Survey of Canada, nd). Using Mann-Kendall trend testing to see whether streamflow is changing over time in combination with Sen’s Slope to find the magnitude of the trend, I examined monthly flows, with some records spanning over 60 years (Hipel & McLeod, 1994). This analysis used recorded flow data and does not account for water withdrawals, which are generally limited at these upstream stations.
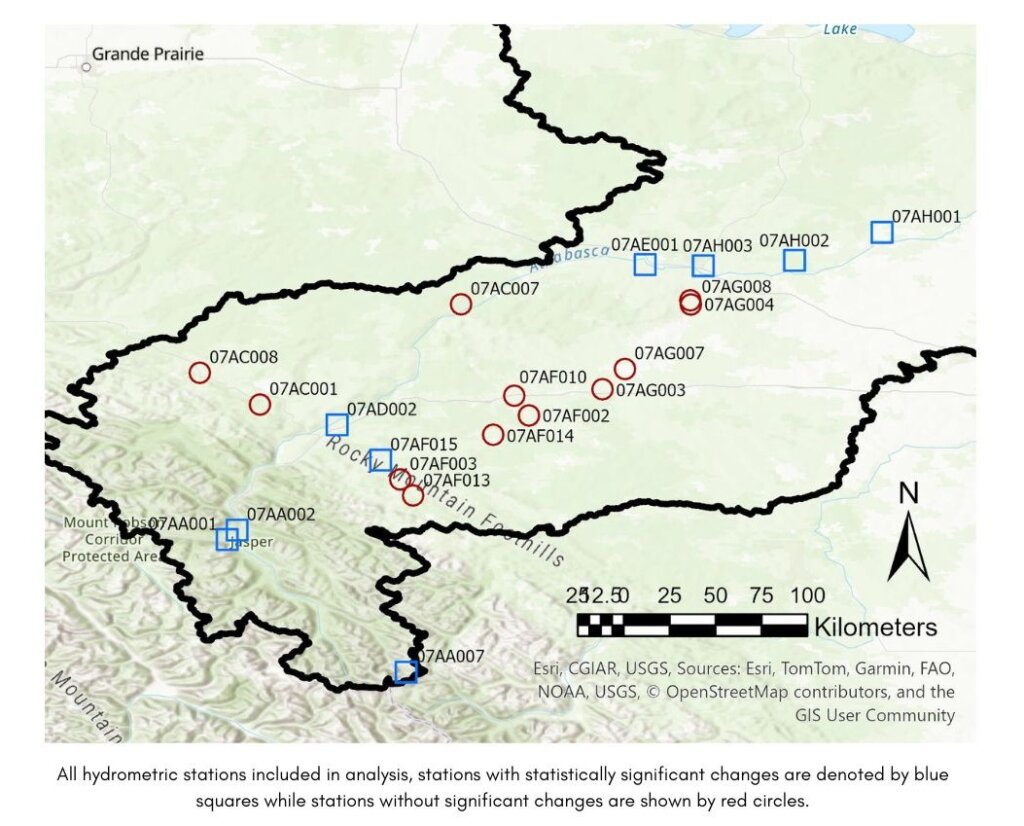
The results reveal subtle but significant changes. When examining each station’s entire operating season, only two stations showed statistically significant trends:
- Sunwapta River at Athabasca Glacier (07AA007) shows a significant increasing trend of about 237,241 cubic meters of water per year since 1966—equivalent to roughly 95 Olympic swimming pools annually.
- Athabasca River near Windfall (07AE001) exhibits a significant decreasing trend of approximately 22,211,893 cubic meters per year since 1961—more than enough water to supply all of Canada’s household use for two days each year (Government of Canada 2015).
Though there are only two stations that show differences in the amount of water for the whole operating season, there are more seasonal changes. Out of 191 station-month combinations examined, 29 showed statistically significant trends (p < 0.05). Most significant increases occurred in winter and early spring flows, suggesting warmer winters, earlier snowmelt, and shifting water storage and release patterns. In contrast, August was the only month with multiple significant flow decreases, raising concerns about late-summer water availability.
Certain stations stand out:
- Athabasca River near Hinton (07AD002) has significant flow increases in six months, mainly winter and early spring. However, these increases do not fully offset the large August flow decrease.
- Miette River near Jasper (07AA001) and Athabasca River near Jasper (07AA002) show similar patterns: early-year flow increases paired with August declines. This indicates snowmelt is arriving earlier, but water is running out sooner.
- The Sunwapta River at Athabasca Glacier (07AA007) notably shows strong flow increases in May, June, and August, reflecting increased glacier melt.
These early signs of change have important implications. Increased winter flows and earlier spring melt are projected as warming temperatures alter snow and ice dynamics in the Athabasca Basin, potentially affecting ice formation and the timing of spring runoff (Canada WaterPortal, 2020.). Declining late-summer and August flows in the headwaters pose significant ecological and cultural concerns, particularly for Indigenous communities whose identities, livelihoods, and rights are deeply connected to the river (Candler et al., 2009); Alberta Environment, n.d.). As glaciers retreat and snowpack duration diminishes due to climate change, late-summer flows—critical for maintaining cool, oxygen-rich water—are projected to decrease substantially (Water, 2023; Canada WaterPortal, n.d.). This reduction in flow could lead to warmer water temperatures and lower dissolved oxygen levels, stressing cold-water fish species such as bull trout (Salvelinus confluentus) and mountain whitefish (Prosopium williamsoni), which depend on specific thermal and flow conditions for spawning and survival (Morales-Marin et al., 2023). If the trend towards lower August flow holds true for the rest of the watershed, low flows would further affect traditional harvesting, ceremonial use, and the ability to access remote areas by canoe or on foot, with direct impacts on Indigenous knowledge systems and place-based practices (Candler et al., 2009). Moreover, reduced flows coincide with peak demand periods for industrial and municipal water use, raising equity concerns about water governance and the protection of Indigenous water rights.
Key Takeaways
- The Climate Moisture Index (CMI) reveals Alberta’s mountain headwaters are generally becoming wetter, while some drier regions may become drier.
- Winter and early spring flows are increasing at some headwater stations, likely due to warming and earlier snowmelt.
- August flows are decreasing at multiple sites, raising concerns about summer water shortages.
- Only 29 of 191 station-month combinations show statistically significant trends, but these follow meaningful seasonal patterns.
- Hinton (07AD002) shows the most widespread changes in river flow timing.
- Ongoing monitoring is critical, especially in sensitive headwater sub-basins such as the Miette, Sunwapta, and Upper Athabasca Rivers.
Alberta Environment. (2015). Surface water quantity management framework for the Lower
Athabasca River. Government of Alberta.
Alberta Environment. (n.d.). Athabasca River conditions and use. Government of Alberta.
Retrieved July 11, 2025, from https://www.environment.alberta.ca/apps/OSEM/
Canada WaterPortal. (2020.). Climate change in the Athabasca River Basin. Retrieved
July 11, 2025, from https://waterportal.ca/climate-change-in-the-athabasca-basin/
Candler, C., Olson, R., & DeRoy, S. (2009). As long as the rivers flow: Athabasca River
knowledge, use and change. Athabasca Chipewyan First Nation & Mikisew Cree First
Nation. https://acfn.com/wp-content/uploads/2023/08/As-the-River-Flows.pdf
Government of Canada, S. C. (2015, June 19). Potable water use by sector and average daily use. https://www150.statcan.gc.ca/t1/tbl1/en/tv.action?pid=3810027101
Government of Canada, S. C. (2025, June 18). The Daily—Canada’s population estimates, first quarter 2025. https://www150.statcan.gc.ca/n1/daily-quotidien/250618/dq250618a-eng.htm
Hipel, K., & McLeod, A. (1994). Time Series Modelling of Water Resources and Environmental Systems. https://www.stats.uwo.ca/faculty/aim/1994Book/
Hogg, E. H. (1997). Temporal scaling of moisture and the forest-grassland boundary in western Canada. Agricultural and Forest Meteorology, 84(1–2), 115–122. https://doi.org/10.1016/s0168-1923(96)02380-
Morales-Marín, L. A., Rokaya, P., Sanyal, P. R., Sereda, J., & Lindenschmidt, K. E. (2019). Changes in streamflow and water temperature affect fish habitat in the Athabasca River basin in the context of climate change. Ecological Modelling, 407, 108718-. https://doi.org/10.1016/j.ecolmodel.2019.108718
Natural Resources Canada. (2016). Climate moisture index for Canada—Open Government Portal. Retrieved July 9, 2025, from https://open.canada.ca/data/en/dataset/de1704c8-ba69-4e66-ac4b-13b966e2eedf
Natural Resources Canada. (2022). Climate moisture index for Canada—Climate Moisture Index (English ESRI File Geodatabase)—Open Government Portal [Dataset]. https://open.canada.ca/data/en/dataset/de1704c8-ba69-4e66-ac4b-13b966e2eedf/resource/257cc82e-594a-413c-9e87-dd34e7165381
NiCHE. (2025.). The Athabasca River, Indigenous knowledge, and adapting to danger. https://niche-canada.org/2025/04/17/the-athabasca-river-indigenous-knowledge-and-adapting-to-danger/
Sharad Aryal, Mukand S Babel, Anil Gupta, Babak Farjad, Dibesh Khadka, & Quazi K Hassan. (2024). Assessment of hydrological baseline condition and its alteration in Athabasca River Basin, Canada Assessment of hydrological baseline condition and its alteration in Athabasca River Basin, Canada. Journal of Hydrology. Regional Studies, 53, 101805-.
Shourov, M. (n.d.). pymannkendall: A python package for non-parametric Mann-Kendall family of trend tests. (Version 1.4.3) [Python; OS Independent]. Retrieved July 10, 2025, from https://github.com/mmhs013/pymannkendall
Water Survey of Canada. (n.d.). Hydrometric Station Number Index—Water Level and Flow—Environment Canada [Dataset]. Retrieved April 21, 2025, from https://wateroffice.ec.gc.ca/station_metadata/station_index_e.html?type=stationNumber&stationLike=07
